Visuals allow us to quickly process information, which is why infographics are such effective communication tools. When we hear information, we can recall 10% of it three days later, but if we see a visual with the information, we can remember 65% (Brain Rules). It’s no wonder infographics become so memorable.
On top of memorability, here are 3 more benefits of business infographics:
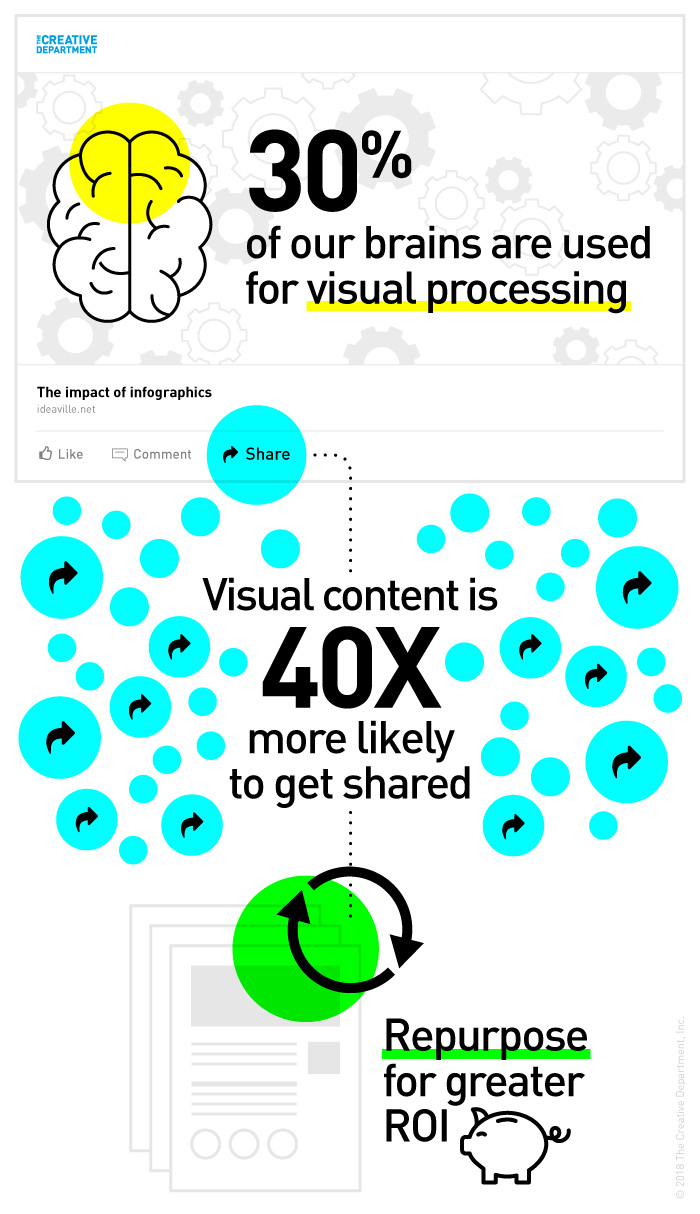
1. Easy to digest.
With 30% of our brains devoted to visual processing (compared to 8% for touch and 3% for hearing), we process images and graphics much more quickly than plain text. If you’re targeting a tight-for-time audience, bite-sized information is especially valuable in reaching them.
2. Easy to share.
Visual content is 40X more likely to get shared on social media than other types of content (Hubspot).
3. Easy to repurpose.
Extend the life of your infographics in the digital space. Zoom in on a portion of an infographic to highlight a key stat, or direct users to the visual content in reports, white papers, case studies, and blogs. You’ve already invested the time and money to develop the original content. Now, repurposing it gives you a greater return on investment.
The not-so-easy part comes in the actual creation of an infographic.
What it takes
Mingling various pieces of data to create one cohesive infographic takes time. It seems contradictory to say a simple infographic is complicated, but its development often demands a deep understanding of the subject and a solid vision for its execution.
What we do
We help clients harness strategy and focus messaging before creating any design. Often, data is compiled by our clients — the industry experts. In our role as strategic consultants, we can guide messaging, organize and simplify information, ultimately building a narrative that puts your insights in the limelight.
We can develop copy or edit long lines of text into quicker info-bytes. By rendering content to simplest form, we ensure a clear hierarchy of information, and as a result, we produce a more successful and compelling infographic.
A visual alternative to the infographic is something we like to call an “infolist.”
You can see the full example of this in a project for client SMG. This is a great solution when you want to expound your expertise. Still easily consumed and visually supported, an infolist bears the same 3 benefits listed above.
Do you need a consultant and design studio to bring your industry findings to life? We’d love to find the right solution for you. Call or email us today.